RESUMEN
Información trimestral de la biomasa
del atún aleta amarilla (Thunus albacares)
en el Océano Pacifico del Este es
utilizada para evaluar el impacto del fenómeno
de El Niño (ENSO) sobre la abundancia
de esta especie. El período de 1967-1997
fue utilizado para el análisis de
la dinámica de esta variable utilizando
métodos gráficos (graficas
de valores crudos y gráficas de espacio
de fases). Los cálculos de los correspondientes
eigenvalores permiten calcular la tasa intrínseca
de crecimiento poblacional del atún
en esta región, así como la
óptima explotación de este
recurso. Desde el año de 1967 es
observada una tendencia a disminuir en la
población alcanzando valores críticos
debajo de sus valores de equilibrio o capacidad
de sostén en la región. Esta
tendencia se mantiene excepto por interrupciones
ocasionales de mayores valores correspondientes
a años de El Niño (ENSO).
Desde 1982 correspondiente a la ocurrencia
de un El Niño de gran magnitud el
sistema parece rejuvenecer y contener una
enorme cantidad de energía que le
permite recuperarse por encima de su capacidad
de sostén para finalmente después
de 12 años regresar otra vez a su
proceso de declinación. Los ángulos
de intercepción de ambas líneas
(línea de equilibrio y línea
del espacio de fases), sugieren que el sistema
presenta comportamientos predominantes que
van de oscilatorios inestables a comportamientos
caóticos, (table1). Los resultados
nos dicen que el óptimo uso del recurso
atunero en la región es favorecido
en años después de un evento
de ENSO y desfavorecido en años previos
a un evento de ENSO. Estos resultados sugieren
que una explotación racional de este
recurso debería estar basada en capturas
menores en un 13% de las capturas normales
durante períodos del ENSO y de un
44% mayores en años después
de ocurrido dicho evento.
Palabras
Clave
Atún aleta amarilla, optimo uso de
recursos naturales. El Niño (ENSO),
Pacifico de Noreste, manejo de recursos
naturales.
ABSTRACT
Three-month biomass dynamic of yellowfin
tuna fish (Thunus albacares) in Eastern
Pacific Ocean was used in order to evaluate
the impact of Enso phenomenon on this species.
The period 1967-1997 was selected for the
analysis of the dynamics of this variable
using graphic methods (graphs of crude data
and space phase graphs).
Calculation of the correponding eigenvalues
allowed estimation of the derived intrinsic
population growth rate of tuna fish in this
region as well as the optimun exploitation
of this resource. From years 1967 on a decreasing
trend in population is observed reaching
critical values below equilibrium or maintaince
capacity. This trend was maintained except
for occassional interruptions of higher
values corresponding with ENSO years. From
1982 on the systems seems to contain an
enormous amount of energy allowing recuperation
of the system above sustainance capacity
to finally start the declining process.
The angles of intersection of both lines
(equilibrium line and phase space line)
suggest that the system displays a predominant
behavior going from unstable oscilation
to chaotic mode, (table 1).
Results show that optimum use of tuna fish
resource in this region is favorable in
years following an ENSO event and unfavourable
in those years previous to ENSO. These results
suggest that a rational explotation of this
resouce should be based on lower captures
(13 % values) of the average normal captures
biomass during ENSO periods and more than
44 % in years following the occurrence of
this event
Keywords
Yyellowfin tuna, optimum use of resource,
ENSO, North east Pacific, natural resouces
management.
1. INTRODUCTION
ENSO
or El Niño Southern Oscillation is
a well known phenomenon characterized by
interannual warming of Pacific ecuatorial
waters (Timmerman, 2003). Seventy percent
of the world tuna catch take place in this
region and yellow fin tuna being the pedominant
species of this catch (Diaz, 1992; Ortega
1998). Recent studies have found that tuna
population dynamics is influenced by ENSO
phenomenon.
Estimates
of use ratio of this resource might contribute
with required information to propose sustainable
management strategies for this species in
the Eastern Pacific Ocean.
While
fishing has been practiced since the beginnig
of civilization its scientific management
dates from recent times. Pioneering work
on fisheries management are the proposals
by (Verhuls T 1838 and Schaefer 1954) the
first one based on the logistic equation
and the second on production. Variations
of these two models have been proposed by
(Fox 1975 and Pella and Tomlinson 1969,
Walter 1973 and Schnute, 1977, 1985) based
on Shaefer’s production model.
Studies
of fisheries were first centered on estimation
of areas of abundance such as the technique
of tagging and recapture (Sparre and Venema,
1998) catch by unit effort (De Lury, 1947),
mortality diferential and virtual population
(Fry, 1949). Later, these studies were centered
on population dynamics.
Models
for the analysis of fish population dynamics
may be classified in four large groups:
the first group is represented by the surplus
production model (Schaefer, 1954) using
production as sole variable: the second
group is represented by the analytical model
(Ricker, 1958) which considers population
as the sum of characteristics implicit in
its individuals; the third group is constituted
by time series models (Bazigos, 1983; González,
1986 and Sun and Yeh, 1998) using statistical
methods in order to analyze historical population
magnitudes; the fourth group is formed by
models relating the resource with the environment
(Ritter and Guzman, 1979, 1982, 1984; Ritter
et al 1979; 1982, 1985; Diaz 1992 and Ortega
1998).
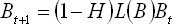
2. METHOD
Yellow fin tuna biomass (for a three month
period) was calculated for period 1967 –
1997 and for the Eastern Pacific Ocean using
information on the tuna numbers and for
each group and applying the table weight/age
published by the (Inter American Commission
on Tropical Tuna 1998).
The
Pacific Ocean is defined as the zone limited
by the coast line of the Americas between
40ON and 40OS and the 150O W meridian (Fig.
1).
Raw
data graphs and yellow fin tuna of space
phase biomass were produced in order to
identify their behavior. Stability of the
system was analyzed by means of population
eigenvectors and balance by (Vandermeer
1972 and Ritter et al 2004) graphic method.
Finally these results were used to estimate
optimum ratios of the fisheries resource.
Graphic
analysis of the dynamic behavior of the
system
Once a stable age distribution of the population
is reached the proportional representation
of each group (x) remains constant and the
numbers or total biomass of the population
may remain constant or either grow or decrease.
Thus
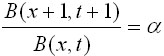 Ec.
1 Ec.
1
 Ec.
2 Ec.
2
Where
M is the community matrix, is the biomass column vector of the age
groups and
is the biomass column vector of the age
groups and  is
the finite rate of increment. Once the age
stable distributions has been reached, transforms
into the projection matrix. is
the finite rate of increment. Once the age
stable distributions has been reached, transforms
into the projection matrix.
Any
population that has reached a stable age
distribution having a communitary projection
matrix with constant elements shall behave
in a exponential manner.
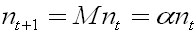
 Ec.
3 Ec.
3
A repeated application of MQ-1 (where Q-1
is the inverse diagonal survival matrix
) to vector  shall
eventually reach a point where relative
proportion of elements in vector shall
eventually reach a point where relative
proportion of elements in vector  will
remain constant as well as constant age
distribution. will
remain constant as well as constant age
distribution.
However,
addition of Q-1 means that the populations
will reach a constant density K as stated
in the logistic equation. At this point
stable age distribution will reach a stationary
age distribution.
Eigenvalues
of matrix M are equal to antilogarithm of
intrinsic rate of natural increment 
. When MQ-1n =   is
equal to one since population is in a stationary
state and thus population as a whole will
grow according to the logistic equation.
Therefore, the populations will reach a
stable age distribution when all elements
of Q are equal to the dominant eigenvector
of matrix M. is
equal to one since population is in a stationary
state and thus population as a whole will
grow according to the logistic equation.
Therefore, the populations will reach a
stable age distribution when all elements
of Q are equal to the dominant eigenvector
of matrix M.
For small population fluctuations (measured
by its communitary matrix and where time
to return to balance values is measured
by the real part of maximum negative eigenvector
 real (
 )
(max), biological stability is given by )
(max), biological stability is given by
 . .
However,
 ifis
less than , ifis
less than ,   one
half the environmental variance, the population
will suffer large fluctuations with an extintion
trend. For this reason the ecosystem stability
will be given by the balance of biological
stability within the ecosystem and also
by the magnitude of the variance of the
environmental fluctuation one
half the environmental variance, the population
will suffer large fluctuations with an extintion
trend. For this reason the ecosystem stability
will be given by the balance of biological
stability within the ecosystem and also
by the magnitude of the variance of the
environmental fluctuation (May, 1973).
One way to analyze this dynamic behavior
is to graph the population biomass in time
t versus t+1 and then analyze the intersection
points to a 450 straight line representing
the equilibrium levels or local points of
maximum carrying capacity. The slope at
this point of intersection will give the
eigenvalue ( ).
When this eingenvalue is shown to be less
than –1 the system is oscillatory
but stable: if the eigenvalue is between
0 and +1 the system is asymptotically stable
and finally if the eigenvalue is greater
than +1the system is asymptotically unstable.
The eigenvalues and the intrinsic rate of
growth ( ).
When this eingenvalue is shown to be less
than –1 the system is oscillatory
but stable: if the eigenvalue is between
0 and +1 the system is asymptotically stable
and finally if the eigenvalue is greater
than +1the system is asymptotically unstable.
The eigenvalues and the intrinsic rate of
growth ( )
are related according to the following expression: )
are related according to the following expression:
  in
which the eigenvalue of the communitary
matrix is equal to antilogarithm of intrinsic
rate of natural increment ( r) (Vandermeer,
1981, Ritter et al 2004) in
which the eigenvalue of the communitary
matrix is equal to antilogarithm of intrinsic
rate of natural increment ( r) (Vandermeer,
1981, Ritter et al 2004)
Determination
of optimum rate of use of the fisheries
resource
Let us consider the generalized logistic
model given by
(Pella and Tomlinson 1969) as:
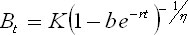 Ec.
4 Ec.
4
where
 is the degree of asymmetry of the production
curve and the Leslie’s biomass matrix
model given by
is the degree of asymmetry of the production
curve and the Leslie’s biomass matrix
model given by
 Ec.
5 Ec.
5
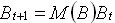
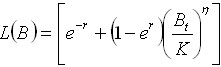
If
B maintains the same form as the associated
eigenvalues keep with the dominant eigenvalue
M (B) for a specific value B, then
 Ec.
6 Ec.
6
where L (B) is the dominant eigenvalue of
M (B). It may be seen that when L (B) =
1 the population will be in equilibrium.
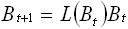
For
the generalized logistic model Bt is discrete
in our initial equation and
 Ec.
7 Ec.
7
This form provides a connection between
the generalized logistic model and Leslie’s
matrix model. Thus L(B) will describe the
manner in which the size of the population
changes in case it would be released of
being artificially maintained to a determined
size.
Function
L(B) is useful when evaluating the population
response to different rates of explotation
(H) and
 Ec. 8
Ec. 8
will
be the required population in order to obtain
the equilibrium size under exploitation
considerations and when (1-H)L(B) = 1, with
(H) having a value such that the rate of
change in the size of the population reaches
a maximum value and will be given by
 Ec.
9 Ec.
9
3.
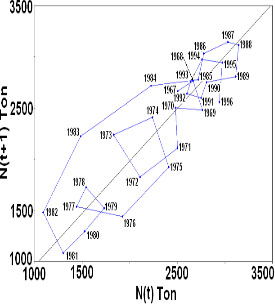
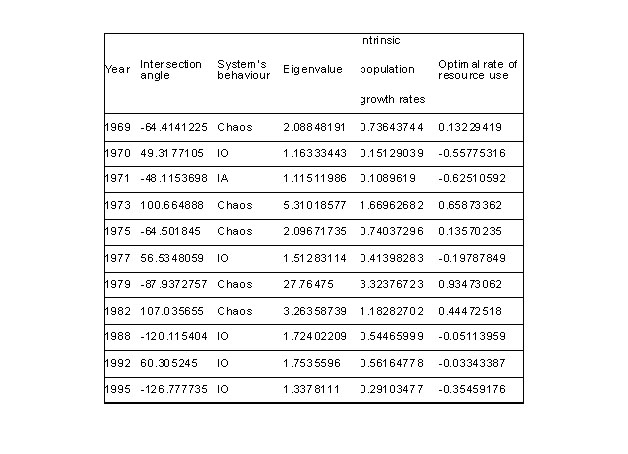
RESULTS
Graphic
analysis of t versus t+1 of yellow fin tuna
biomass showed in a period of 31 years (1967-1997)
11 intersections with the equilibrium straight
line at 45o (figure 3). The slopes of these
intersection lines suggest that the system
has a dominant behaviour varying from unstable
to chaotic (table 1) with exception of year
1971 when behaviour of the system showed
an asymptotic unstable manner.
Intersections with 45o line are present
in years when tuna biomass shows points
of inflexion (figure 2) whereas inflexion
point at minimum level are determined by
a population decrement at the time of oceanic
warming. Inflexion points of the valley
type are determined by the increment shown
by the population right after oceanic warming.
Intersections with the 45o line appear before
and after the ENSO events.
On
yellow fin tuna biomass space phase graph
are shown the various ways mentioned above
in which from 1967 a decreasing trend is
evident. Lowest equilibrium values (or sustainable
capacity) are then displayed maintaining
its tendency toward minimum values only
occasionally interrupted by curls indicating
the presence of an El Niño phenomenon.
From 1982 the system seem to possess large
energy exccedances allowing the system to
recover above sustainable capacity until
it reaches a natural attractor in which
populations are at a maximum initiating
then a process of decadence (Figure 3, table
1).
For
optimum rates of the yellow fin tuna resource
calculated with the table it was observed
that in years before the ENSO event negative
rates were present, indicating that in these
years the resource should not be extracted
at high rates. However, the use of the resource
are positive and considerable high (from
0.13 to 0.93) allowing a greater use of
the resource. It should be noted that in
years when behaviour was chaotic they present
also high positive rates of use and are
proportional and near 90ª interseccion
value.
On
graph of bidimensional space phase of yellow
fin tuna biomass (fig 2) a close figure
behaviour was observed showing variable
periodicities rotating in a counter it is
clockwise direction whereas on the tridimensional
space phase graph rotation on the third
axis was observed in the same sense. These
behaviours describe an attractor in the
dynamics of this variable.
4.
CONCLUSIONS
ENSO phenomenon has an impact on the yellow
fin tune biomass in the Eastern Pacific
Ocean. In its cool phase it may decrease
population size up to 65% while in its warm
phase it may be linked to a 93% increase.
Surface
ocean temperature and food availability
are the main factors modified by ENSO impacting
on yellow fin tuna population dynamic.
Yellow fin tuna population dynamic shows
a behaviour going from unstable oscillating
to chaotic. It is suggested that the resource
be managed with ratios from less than 13%
in ENSO warm phase to ratios of up to 44%
in cool phase ENSO conditions. It is hoped
that results from this work will permit
that the management of this resource be
based on maximum sustainable yield of tuna
fishenes, saving millions of dollars while
preserving the resource.
The proposed methodology combines advanced
simulation and optimization techniques within
the fields of quantitative ecology, climate,
simulation, climate change and ocean-atmosphere
interactions.
While
some authors have reported the influence
of ENSO on the dynamics of certain fisheries
like that of yellow fin tuna this relationship
has not been quantified and therefore this
variable had not been incorporated in models
of management of this resource
Results obtained will make possible the
long-term planning of the sustainable management
of a relevant resource such as the yellow
fin tuna.
Optimization of efforts of the fisheries
fleet as well as the annual size catch will
result in sustantial profits in millions
of dollars for the Eastern Pacific tuna
fleets, (including the Mexican) with the
added benefit that the management of the
resource will be based on its preservation.
ENSO is an ocean-atmosphere phenomenon affecting
many natural resources; knowledge of its
impact on them will allow a more rational
use of these resources. Methodologies proposed
in this work may be of use for the above
mentioned goals.
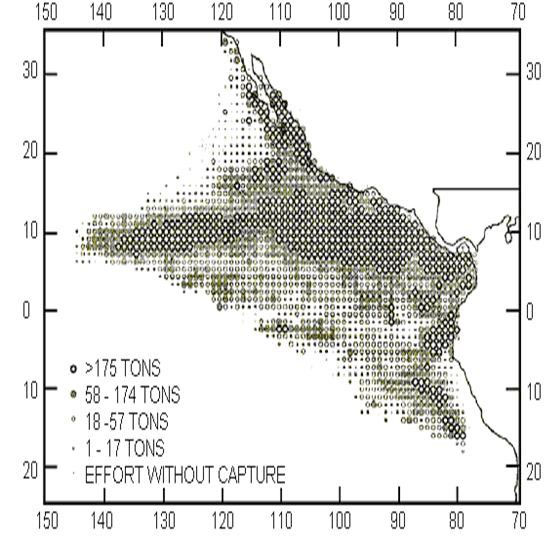
Figure
1. The Eastern Pacific Ocean and the mean
captures during 1979-1993 (taken from IATTC,
1994)
Figure
2. Yellow fin tuna fish biomass in the East
Pacific Ocean, period 1967-1997.
Figure
3. Biomass Nt versus N(t+1) of yellow fin
tuna fish in the Easthern Pacific Ocean.
Period 1967-1997.
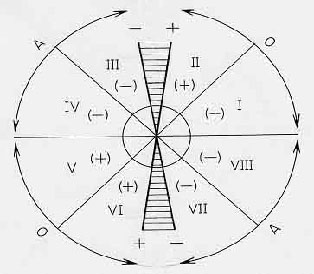
F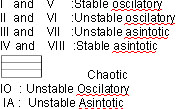
figure
4 graphic method modifyed by (Ritter et
al 2004) in order to calculate phase space
eigenvalues as well as the system’s
behavioural patterns divided in a: oscillatory,
asymptotic, stable or unstable and chaotic
area.
Table
1. Estimates by graphic analysis (Vandermeer
1972 and Ritter et al (2004)) of the intersection
angle, system’s behaviour, eigenvalue,
intrinsic population growth and ratio of
optimum use of the resource calculated by
the tuna biomass dynamics for period 1967-1997
in the Eastern Pacific Ocean
5.
ACKNOWLEDGEMENTS
I would like to tank Sabina Garfias Mijangos,
Alfonso Salas and Alfonso Estrada for their
interest and helpful encouragements.
6. REFERENCES BIBLIOGRAPHIC
Bazigos,
G. P. (1983). Analysis of univariate fisheries,
statistical time series. Fisheries information,
data and statistical service fisheries department.
Nicaragua.
Comisión Interamericana Del Atún
Tropica. (1998). Informe anual. California
U.S.A.-
De -Lury, DB. (1947). On the estimation
of biological population. Biometrics.Vol.
3.
Diaz, P. J. (1992). Modelado de las pesquerías
de túnidos en el Pacífico
mexicano atún aleta amarilla). Tesis
Maestría en Ciencias (Oceanografía
biológica y pesquera). UNAM. 72 pp.
Fox, W.W. (1975). Fitting the generalized
stock-production model by least squares
and equilibrium approximation. Fish. Bull.
73: 23-37.
Fry, F. E. J. (1949) Statistics of a lake
trout fishery. Biometrics, 5: 27-67.
Gonzalez, C. J. (1986). Variabilidad y predictibilidad
de las capacidades de sostén y su
influencia en las abundancias poblacionales
del atún aleta amarilla (Thunnus
albacares) de las zonas históricas
de producción pesquera del océano
pacífico oriental, a través
del análisis de series de tiempo.
Tesis. Maestría en Ciencias (Biología).
UNAM. México. 90 pp.
May R. (1973). Stability in randomly fluctuating
versus environments. The American Naturalist.
107(975):619-650.
Ortega, G. S. (1998). Análisis de
las fluctuaciones espacio temporal en la
abundancia de atún en el Océano
Pacífico Oriental. Tesis Doctorado
(Biología). Fac. de Ciencias. UNAM.
186 pp.
Pella, J. J. y Tomlinson, P. K. (1969).
A generalized stock production model. .
Inter—Americana Trop. Tuna Comm. Bull.
13(3):421-496.
Ritter, W. E. (1958). Handbook of computation
for biological statistics of fish population.
Bull. Fish. Res. Board Can., 199, 300 pp.
Ritter, O. W.; R. S. Guzman; C. E. Buendía
Y A. T. Morales. (1979). Sobre la evaluación
de los recursos naturales (aspectos ambientales
en la productividad oceánica), Parte
II. Anales del Instituto de geofísica.
25:135-152.
Ritter, O. W.; R. S. Guzman. (1982). Efectos
meteorológicos y oceanográficos
en la productividad del Océano Pacífico
del Este. Geofísica. 17:23-39.
Ritter, O. W.; G. R. Klimek y R. S. Guzmán.
(1982). Sobre la abundancia, distribución
y comportamiento del atún aleta amarilla
en el Océano Pacífico del
Este y su correlación a condiciones
físico-ambientales. Geofísica.
17:6-22.
Ritter. w. y r. s. Guzmán, R.S. (1984).
Modelo generalizado de producción
pesquera con dependencia ambiental, una
aplicación en el Golfo de Tehuantepec.
Geofisica. 20:21-29.
Ritter, O. W.; Jauregui, O. E.; Guzman,
R.S.; Estrada, B, A.; Muñoz, N.,
H.;Suarez S. J. y Ma. Del Carmen corona
(2004). Ecological and agricultural productivity
indices and their dynamics in a sub-humid/semi-arid
region from Central Mexico. Journal of Arid
Environments 59, 753-769.
Schaefer, M. B. (1954). Some aspects of
the dynamics of populations important to
the management of the commercial marine
fisheries. Inter-Amer. Trop. Tuna Comm.
Bull. 1(2):25-56.
Schnute, J. (1977). Improved estimates from
the Schaefer production model: theoretical
consideratons. J. Fish. Res. Bd. Canada
34: 583-603.
Schnute, J. (1985). A general theory for
analysis of catch and effort data. Can.
J. Fish. Aquat. Sci. 42: 414-429.
Sparre, P. y Venema, S. C. (1998). Introduction
to Tropical Fish Stock Assesment. Part 1:
Manual FAO, Roma.
Sun, C. L. y Yeh, S. Z. (1998). Arima modeling
and forecasting the albacore catch and CPU
of the Taiwanese tuna logline fishery in
the South Atlantic Ocean. Acta Oceanographica,
Vol. 36, NO2, 125-137.
Timmermann, A. (2003). Decadal ENSO amplitude
modulations: a nonlinear paradigm. Global
and Planetary change. 37:135-156.
Vandermeer, J. H. (1972). Elementary mathematical
ecology. John Wiley. New York.
Verhulst, P. F. (1838). Notice sur la loi
que la population pursuit dans son accroissement.
Corresp. Math. Phys. 10:113-121.
Walter, E. (1973). Delay-differential equation
models for fisheries. J. Fish. Res. Board
Can. 30:939-945.
|